Summary: Roy Spencer has come up with yet another “silver bullet” to show that climate sensitivity is lower than IPCC estimates. I.e., he fits a simple 1-box climate model to the net flux of heat into the upper 700 m of the ocean, and infers a climate sensitivity of only about 1 °C (2x CO2). There are several flaws in his methods–inconsistent initial conditions, failure to use the appropriate data, and failure to account for ocean heating deeper than 700 m. (He fixed the last one in an update.) All of these flaws pushed his model to produce a lower climate sensitivity estimate. When the flaws are corrected, the model estimates climate sensitivities of at least 3 °C, which is the IPCC’s central estimate. In any case, a simple 1-box climate model does not appear to be adequate for this kind of analysis over only a few decades. But while Spencer’s latest effort doesn’t really do any damage to the consensus position, it turns out that it does directly contradict the work he promoted in The Great Global Warming Blunder.
Since I launched my blog a year ago, I’ve had the chance to examine the claims of a number of climate contrarians. One thing that has surprised me is how often the contrarians seem to think they’ve come up with a “silver bullet” to shoot down mainstream scientific views about how sensitive the climate is to forcing by greenhouse gases, etc. By “silver bullet” I mean a very simple, direct, and clear demonstration that the mainstream is flatly wrong. Why is this so surprising? Because even though climate response is a complicated subject, overall sensitivity has been estimated at least nine different ways, and many of these methods are based on paleoclimate data, rather than model output. Since all of these methods have produced roughly the same answer, the vast majority of climate scientists have concluded that the climate is pretty unlikely to be insensitive enough to avoid major problems if we continue to burn fossil fuels like we have been. In other words, the possibility of a silver bullet in this case seems remote.
In my career as a scientist I’ve come up with a couple “silver bullets,” although they weren’t about anything so dramatic, but the fact is that nine times out of ten when I’ve gotten excited because I THOUGHT I had one, further investigation showed that I had made some minor mistake, and in fact the scientists whose work I was examining were right. What bothers me about the climate contrarians is that it doesn’t seem to occur to many of them to keep digging once they get an answer they like.
Roy Spencer is a prime example of a contrarian scientist who exhibits this tendency. As I noted in my recent review of Spencer’s The Great Global Warming Blunder, he has a history of publishing dramatic new evidence for low climate sensitivity… and then letting others sort out the serial errors he’s made. E.g., he said the reason he published his book was that he could virtually prove climate sensitivity is low and recent warming has been the result of chaotic natural variation, but establishment scientists had blocked publication of this silver bullet in the peer-reviewed literature. I took apart his work, however, and found out that he was only able to get the answer he liked by plugging physically unreasonable parameter values into his model. What’s more, his results depended on a numerical fitting procedure that I hesitate to call “statistical,” because no statistician would ever suggest such a thing. Spencer’s answer? He says he’s too busy writing papers for the peer-reviewed literature to respond to a critique on a blog.
Well, in a new blog post, Roy claims to have yet another silver bullet that is supposed to trump those nine other methods for estimating climate sensitivity. That is, he has modified a “simple climate model” (i.e., a zero-dimensional or 1-box climate model) to produce a climate sensitivity estimate based on recently published ocean heat content (OHC) data. Here again, I’m going to closely examine Spencer’s methods. Unsurprisingly, it turns out that this particular silver bullet doesn’t do any damage to the consensus on climate sensitivity. However, my readers might be a little surprised to find out that Spencer’s discussion of his new approach provides a very clear demonstration of why the modeling results he promoted in his book were meaningless. Maybe it is a silver bullet after all.
Ocean Heat Content and Net Radiative Flux
Spencer focuses on the OHC data series published by Sydney Levitus and colleagues. (Here is the explanatory page for the data set.) The series estimates the total heat content of the 0-700 m layer of the ocean since 1955, in units of 10^22 J. Now, if you take into account the total surface area of the ocean (~3.6 x 10^14 m^2) it’s easy to calculate the net flux of energy going into the upper 700 m of the oceans.
Figure 1 shows the net heat flux into the 0-700 m layer of the ocean, calculated as explained above. I’ve also digitized Spencer’s calculated flux from this figure and plotted it. Notice that both lines plot exactly on top of one another. This shows that both he and I were at least using 1) the same OHC data, and 2) the same ocean area.

Figure 1. Heat flux into the 0-700 m layer of the ocean from 1956-2010, calculated by me (black) and Roy Spencer (red).
Spencer realized that he could interpret this data through the lens of a modified version of his simple climate model. (I explained the original version more thoroughly here.) The modified model is shown in Eqn. 1, where Cp is the total heat capacity of a 1 x 1 x 700 m column of water, T[700] is the average temperature anomaly of the 0-700 m layer of the ocean relative to some equilibrium, dt is the time step, F is the radiative forcing of the system relative to equilibrium, a is the feedback factor, and Ts is the average surface temperature anomaly of the ocean relative to equilibrium.
Cp*(dT[700]/dt) = F – a*Ts (1)
Let’s restate that in English. On the left side of the equation, we multiply the heat capacity of a 700 m column of water that is 1 m^2 on top (700 m * 4180000 J/m^3/K) by the rate of change of the average temperature of the 0-700 m layer (units = K/s). When we multiply those out, we get the net flux of heat energy into the ocean (units = W/m^2). So the left side of the equation represents the same thing we plotted in Fig. 1. The net flux of heat into the ocean equals the forcing on the system (units = W/m^2) plus the feedback (units = W/m^2). The feedback on the system is just the response of the system to a temperature change, in terms of a change in the amount of radiation sent back into space. In Spencer’s model, the feedback term includes the Planck response (change in black-body radiation with a change in temperature), and whatever else (changes in cloud cover, water vapor, and so on, in response to a temperature change.) The feedback is represented as the negative of the feedback factor multiplied by the surface temperature anomaly.
Now, James Hansen at NASA has published estimates of climate forcing (both human and natural) since 1880, and Spencer noted that the HadSST2 sea surface temperature series seems to be rising about 3.5x as fast as T[700]. Spencer’s idea was that if he knew the net heat flux into the ocean and the forcing on the system, and could link the the ocean surface temperature to the 0-700 m layer temperature, all he had to do was run Eqn. 1 in a finite difference model and adjust the feedback factor until the net heat flux in the model output adequately mimicked the real net heat flux data (Fig. 1).
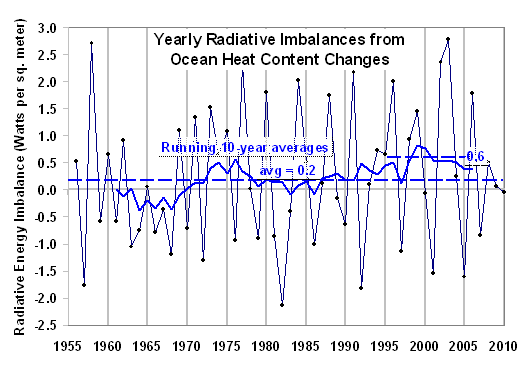
Fig. 2 plots the net heat flux output from Spencer’s model along with a 10-year smoothed version of the data in Fig. 1. Readers will note that the model output doesn’t seem like that good of a fit to the smoothed version of the real heat flux data. However, Spencer doesn’t appear to have been fitting the model output to the entire data series. He appears instead to have been trying to get the same average flux value of 0.2 W/m^2 over the whole series, and an average of about 0.6 for the period 1995-2005.

Figure 2. Hansen's forcing values are plotted here along with the feedback and net heat flux values generated by Spencer's model. A 10-year smoothed series of the real heat flux values (Fig. 1) is also plotted here for comparison.
The a value he came up with was 4 W/m^2/K, which is equivalent to a climate sensitivity of about 1 °C per doubling of CO2. Since the IPCC puts a lower limit on climate sensitivity of 1.5 °C and a probable range of 2-4.5 °C, Spencer asks,
Now, what I do not fully understand is why the IPCC claims that the ocean heat content increases indeed ARE consistent with the climate models, despite the relatively high sensitivity of all of the IPCC models.
Actually, the IPCC is more equivocal about whether the GCMs they use account for OHC data. They say,
Although the heat uptake in the ocean cannot be explained without invoking anthropogenic forcing, there is some evidence that the models have overestimated how rapidly heat has penetrated below the ocean’s mixed layer (Forest et al., 2006; see also Figure 9.15). In simulations that include natural forcings in addition to anthropogenic forcings, eight coupled climate models simulate heat uptake of 0.26 ± 0.06 W m–2 (±1 standard deviation) for 1961 to 2003, whereas observations of ocean temperature changes indicate a heat uptake of 0.21 ± 0.04 W m–2 (Section 5.2.2.1). These could be consistent within their uncertainties but might indicate a tendency of climate models to overestimate ocean heat uptake.
They go on to explain that there could be problems with how the models handle heat transfer in the ocean, or with the OHC data itself. (E.g., the upper 300 m of the ocean is fairly well observed, and the models agree well with the data there, but there isn’t nearly as much data for greater depths so there could be sampling artefacts.)
In fact, James Hansen has recently brought up this issue, as well. In any case, the IPCC does at least indicate that their models get in the same ballpark as the OHC data, so the dilemma Spencer poses is reasonable to bring up.
The Easy Answer
There are a number of ways we can answer Roy Spencer’s dilemma, but perhaps the easiest one is simply to note that a 1-box climate model probably isn’t adequate to answer the kinds of questions he is using it for. Regarding this issue, Spencer characterized the climate modeling community in an unflattering light in The Great Global Warming Blunder (p. xxii).
Climate models are built up from many components, or subsystems, each representing different parts of the climate system. The expectation of the modelers is that the greater the complexity in the models, the more accurate their forecasts of climate change will be. But they are deceiving themselves. The truth is that the more complex the system that is modeled, the greater the chance that the model will produce unrealistic behavior.
In my experience, this is a gross mischaracterization of the climate modeling community. The truth is that modelers generally understand “Einstein’s Razor” very well, i.e., that theories and models “should be made as simple as possible, but no simpler.” In their textbook, Mathematical Modeling of Earth’s Dynamic Systems, Rudy Slingerland and Lee Kump put it this way. “Bad models are too complex or too uneconomical or, in other cases, too simple” (p. 2).
In this case, a potential problem with a model like Eqn. 1 is that all the feedbacks are lumped together, but in reality different climate feedbacks operate on different timescales. E.g., look at Fig. 2 again, and note that the forcing series has a number of sharp downward spikes, which are due to major volcanic eruptions, and almost identical spikes appear in the heat flux model output. And yet, no such spikes appear in the real data. Why? Because if different feedbacks operate on different timescales, then those kinds of short-term perturbations tend to get smoothed out in the overall climate response.
In a recent blog post, climatologist Isaac Held examined just this issue. He actually took a model exactly like Spencer’s and fit it to the output from a GCM that he uses. Then he estimated the equilibrium climate sensitivity of both models by running them with a constant forcing equivalent to doubling the CO2 in the atmosphere, and finding the temperature they settled into after a while. It turned out that whereas the GCM had a sensitivity of about 3.4 °C (2x CO2), the simple model only had a sensitivity of about 1.5 °C. This is interesting, because the simple model was parameterized specifically to mimic the output of the GCM. Could it be that the issue of overall climate sensitivity is more complex than a model like Eqn. 1 can address, at least over timescales of a few decades? Could it be that such a model would consistently low-ball its estimated climate sensitivity? One thing is clear–Roy Spencer hasn’t asked questions like these, whereas bona fide climate modelers like Isaac Held have.
Spencer’s Flawed Modeling
What if the opposite is true, however? That is, what if more complex models like GCMs consistently overestimate climate sensitivity, all the while fitting the same data as a more simple model? I’m not really in a position to address that question, but let’s assume for the moment that Spencer’s simple model is adequate to the task. Now the question is, did he apply the model correctly?
Well, no.
First, take another look at Fig. 2 and Eqn. 1. The temperature terms in Eqn. 1 are temperature anomalies, i.e., in a model like this they refer to the difference between the temperature and some assumed equilibrium state. The larger the absolute value of the temperature anomaly, the larger the feedback term becomes, providing a strong pull back toward the equilibrium temperature. The feedback curve in Fig. 2 starts at 0 W/m^2 in 1955, so it is apparent that Spencer began his model in equilibrium in 1955. We can argue about whether the climate was really in any kind of “equilibrium” in 1955, but the trouble doesn’t end there. “Forcing” refers to a change in the energy input relative to some assumed “normal” state. Obviously, if Spencer assumed the climate was in equilibrium in 1955, he should have adjusted his forcing numbers to zero in 1955, as well, but instead he started his model run at 0.34 W/m^2 forcing. Why? Because Hansen’s climate forcing estimate is 0.34 W/m^2 in 1955, but Hansen’s series is referenced to the year 1880. In other words, the entire forcing series is 0.34 W/m^2 too high, given Spencer’s other initial conditions.
Am I nitpicking, here? Remember that the average net heat flux over 1955-2010 is only about 0.2 W/m^2, which is significantly less than the error in forcing. What’s more, if the forcing is uniformly too high, the feedback has to be more negative by the same amount to produce the same net heat flux result. In other words, the a parameter in Eqn. 1 has to be larger than it otherwise would be, indicating a less sensitive climate.
Second, Spencer’s feedback series shown in Fig. 2 is model output, but if the feedback depends on Ts (see Eqn. 1), how can the model spit out BOTH the feedback AND the net heat flux, which depends on changes in T[700]? Spencer gave us a clue when he noted that the rate of change in the HadSST2 global average sea surface temperature was about 3.5x the rate of change in T[700] from 1955-2010. Therefore, I guessed that he had linked the two temperatures together in the model like so (Eqn. 2).
Cp*(dT[700]/dt) = F – a*3.5*T[700] (2)
I ran this model by the finite difference method in Microsoft Excel, using 1 year time steps, and came up with a feedback curve that exhibits a general trend pretty close to that of Spencer’s (see Fig. 3). My curve is a lot more noisy, which could be due to me using a different time step, Roy smoothing the data, or whatever. (I sent two requests to see his code, which he has so far ignored. I also asked him whether I was right that he linked T[700] and Ts by a factor of 3.5 in his model, but he hasn’t responded to that, either. He was kind enough to answer a couple of my questions, however, which was very helpful.) In any case, it’s pretty clear that my model is pretty similar to whatever Spencer did.

Figure 3. Feedback produced by running Eqn. 2 as a finite difference model (blue) compared to the feedback Spencer reported (red).
Even after I asked Roy and he told me the feedback was model output, it actually took a while for me to think of the idea to link the two temperatures by a constant factor. I initially just assumed that he would have used the HadSST2 temperature anomaly as input to the model, because if I already have data for Ts, why make the model generate it? In any case, since Spencer had his model generate the feedback, all we have to do is compare the model feedback values with the HadSST2 data for Ts, zeroed at 1955 and multiplied by 4 W/m^2/K (see Eqn. 1). This comparison is shown in Fig. 4.

Figure 4. Feedback in Spencer's model output (red) compared to the feedback generated by multiplying the HadSST2 sea surface temperature anomaly by 4 W/m^2/K.
Whereas Spencer adjusted the a parameter in his model to fit the net heat flux data, he apparently paid no attention to how well his model reproduced the average ocean surface temperature. Spencer’s feedback curve is never as strong as the one generated using real ocean surface temperatures, so it’s clear that his model-generated ocean surface temperatures are uniformly too low. Therefore, to get the same feedback, his model has to adopt a larger value of a, once again making the climate seem less sensitive than it should be.
Another odd thing about Roy Spencer’s latest modeling adventure is that he doesn’t seem to have taken the normal route of fitting the model to the OHC data via a least-squares regression. Rather, it appears he was trying to make his model produce the same average heat flux over the entire period as the real data (0.2 W/m^2). Given the corrections I outlined above (using real ocean surface temperatures and zeroing the forcing at 1955,) I decided to try both methods to see what kind of feedback parameters I would get. When I did a least-squares regression, varying the feedback factor to fit the OHC data, I got an a value of 1.1 W/m^2/K, which amounts to an equilibrium climate sensitivity of about 3.4 °C. This is not only within the probable range given by the IPCC, it’s very close to their central estimate of 3 °C. When I adjusted the model to produce an average heat flux of 0.2 W/m^2 for 1955-2010, I got an a value of 0.7 W/m^2/K, i.e., a climate sensitivity of about 5.2 °C, which is above the IPCC’s most likely range. I have plotted the smoothed heat flux data along with Spencer’s model output and the output from both my model runs in Fig. 5. Readers should note that all the models (including mine) pretty much suck at fitting the data, reinforcing the point that a simple 1-box climate model probably isn’t the best tool for this job.

Figure 5. Here the net flux of heat into the ocean (subjected to a 10-yr smoothing routine) is compared with Spencer's model and two models I ran.
Finally, Spencer’s readers pointed out in the comments on his blog that the ocean has been heating up below 700 m, as well. Spencer posted an update to his blog entry that says he took into account heating down to 2000 m, and he came up with a climate sensitivity of 1.3 °C, which is a bit larger than his original estimate of 1 °C.
Conclusions
The fact is that a simple 1-box climate model like Spencer’s probably isn’t a very good tool for interpreting the meaning of a few decades of OHC data. But if we try it anyway, we come up with climate sensitivity estimates that are at least as high as the IPCC’s central estimate of 3 °C. In contrast, Spencer’s erroneous estimate is less than half of that at 1.3 °C. Roy Spencer was only able to come up with low sensitivity estimates by committing serial errors that all pushed his estimates in the direction of lower sensitivity. These errors include: inconsistent initial conditions, failure to use the appropriate data, and failure to account for ocean heating deeper than 700 m. (He fixed the last one in an update.) So the fact that Roy Spencer’s analysis contradicts at least nine other methods for estimating climate sensitivity is pretty meaningless.
This is becoming a familiar story. Roy Spencer comes up with some great idea, all but proving the establishment wrong. Instead of trying to work on his idea until it’s in good enough shape to pass peer review, he posts it on a blog or publishes it in a book, and then accuses the other scientists of ignoring evidence. His true believers shower him with accolades (see the comments on his blog), and he leaves it up to others to point out the flaws in his methods.
I will say this in Roy Spencer’s defense, however. At least he sometimes has the grace to admit he’s wrong when someone goes to the trouble to point out his errors. For example, in my recent review of his book, The Great Global Warming Blunder, I pointed out another serious abuse of the same simple climate model he used in his latest blog post. One of the problems I pointed out was that his model assumed a 700 m mixed layer in the ocean, when it is really something more like 100 m. In other words, his model assumed that the entire top 700 m of the ocean heats up and cools down at the same rate, which is nonsense. Afterward, Roy mentioned on his blog that many of his readers had been asking him to respond to my review, but he said he was too busy trying to publish peer-reviewed science to waste his time responding to blog critiques. And yet, in the blog post I’m critiquing here, I found the following frank admissions that I was right.
The reason why we need to use 2 temperatures is that the surface has reportedly warmed about 3.5 times faster than the 0-700 meter ocean layer does, and radiative feedback will be controlled by changes in the temperature of the sea surface and the atmosphere that is convectively coupled to it….
While some might claim that it is because warming is actually occurring much deeper in the ocean than 700 m, the vertical profiles I have seen suggest warming decreases rapidly with depth, and has been negligible at a depth of 700 m.
Ok, so he didn’t specifically acknowledge that he had been wrong about this before, but I’m sure he meant to say that.

Shame on you Barry for criticizing Spencer in a blog post when he’s so “busy writing papers for the peer-reviewed literature”!! 🙂
So, as a geologist, have you seen this video from “American Dad” yet?
http://smg.photobucket.com/albums/v486/gabrianne/?action=view¤t=AmericanDad-Geologist.mp4&sort=ascending
By: Arthur Smith on May 20, 2011
at 1:13 pm
The link didn’t work for me. But I am properly ashamed of my behavior.
By: Barry Bickmore on May 20, 2011
at 3:48 pm
Great post, Barry. I’ve re-posted it at Skeptical Science. Thanks for looking into this!
By: Dana on May 21, 2011
at 12:17 pm
We are so kicking denialist butt with our CMs.
Hoo-Ahh – We’re number one! We’re number one!
By: Die Zauberflotist on May 21, 2011
at 2:40 pm
I wonder if you guys (you, Shumways, and the Skeptical Science guy) ever studied partial differential equations, or know what an analytic function is?
Anyway (shrug), the whole thing is just a diversion. The elephant in the room is that ocean heat content is stagnant.
By: Bart on May 31, 2011
at 1:36 am
It’s stagnant only if you cherrypick a few years of data. I wonder if you have ever studied statistics.
By: Barry Bickmore on May 31, 2011
at 10:17 am
Yeah, sure… 8 years of nothing from the most advanced measurement system ever deployed for the purpose.
That dog won’t hunt.
By: Bart on May 31, 2011
at 8:51 pm
Demonstrating once again that you don’t know much about statistics.
By: Barry Bickmore on June 1, 2011
at 5:34 am
Well, my papers on the subject have only appeared in a few hundred countries at that.
You are grasping at straws.
By: Bart on June 1, 2011
at 9:39 pm
What papers? And how do papers “appear in a few hundred countries”? Did you mail them?
And are you actually denying that it is cherrypicking to draw sweeping conclusions from 8 years of data in a system where interannual variability is greater than the trend over any recent decade?
By: Barry Bickmore on June 1, 2011
at 9:47 pm
“And how do papers “appear in a few hundred countries”?”
I take that to mean you’ve never been published in a major international journal.
“…are you actually denying that it is cherrypicking…”
Sure looks like it to me. That I am, that is. For pointers, you can look starting here, where a number of posters skin and hang out to dry one “kdkd” arguing for your side.
There is a sizable and should-be readily observable amount of heat missing compared what it should be under the AGW hypothesis. Where is it? It cannot be in the deep oceans, because you have assured me repeatedly that there is no significant heating below a few hundred meters. Maybe it’s in all the hot air pouring out of blogs like this?
By: Bart on June 3, 2011
at 1:17 am
Oh, I’ve been published in major international journals. Since I’m not anonymous, you can look up my publication record. I would have trouble looking up the publication record of “Bart”, however, which is why I asked, “What papers?”
I’m still waiting.
I have to say I’m a little skeptical of your claim that all these papers of yours appeared in “a few hundred countries,” since there are less than 200 countries in the world. I’m also a little skeptical of your claim that all these papers were on the subject of statistics, because well, you don’t seem to know much about it.
And since you can’t defend your comments here, you refer me to some other blog where someone ELSE “skinned and hanged out to dry” some guy going by “kdkd,” who was arguing for “my side”. As far as I can tell, they were arguing about how to calculate confidence intervals on a time-series trend. Can you demonstrate that I ever agreed with “kdkd”? If not, why is he on “my side”? And in any case, what does that have to do with your claim that YOU know anything about statistics?
Finally, you say that I “have assured [you] repeatedly that there is no significant heating below a few hundred meters.” Really? I thought I said the opposite. Maybe you’re referring to the fact that I said the ocean’s MIXED LAYER is only 50-100 m deep? Did you notice where I said that IN A 1-BOX CLIMATE MODEL, that should maybe be a little more than 100 m to account for HEAT TRANSFER TO THE DEEP OCEAN?
Please, if you want to convince anyone here that you are capable of participating in an honest conversation about this topic, read the posts carefully, first, and stick to the topic at hand.
By: Barry Bickmore on June 3, 2011
at 9:31 am
“…since there are less than 200 countries in the world.”
My paper trail spans three decades. Several have come and gone in that time.
Really, dude…. you’re obviously just blustering now.
Where’s the heat?
By: Bart on June 4, 2011
at 12:21 am
“This is becoming a familiar story. Roy Spencer comes up with some great idea, all but proving the establishment wrong. Instead of trying to work on his idea until it’s in good enough shape to pass peer review, he posts it on a blog or publishes it in a book…”
Is Roy’s method better or worse than the Hockey Team’s? Suppressing opposing views, refusing FOI requests, asking other members to delete pertinent email, using tricks to obfuscate results that don’t fit the story line etc. ?
Personally, I’ll take the scientist who puts his ideas (and reputation) on the line and opens him/herself to the subsequent criticism and or praise of his peers. Kind of like you do Dr. Bickmore.
By: Daniel on June 3, 2011
at 9:08 pm
Hi Daniel,
As all the “Climategate” review panels have noted,
1. While some of them talked about keeping certain papers out of the IPCC report, those papers in fact made it in. Chest-beating does not equal foul play.
2. Crowing about giving a bad review to some paper is perhaps in bad taste, but it certainly doesn’t mean you are “suppressing opposing views.” I’ve looked at a number of these papers, and they truly deserved to get trashed in review.
3. Refusing FOI requests is bad–and possibly illegal–but some people were using FOI to harass scientists who didn’t have the resources to constantly be digging some of this stuff up. When I asked for Roy Spencer’s code, for example, I didn’t expect him to give full annotations for why he did everything, all changes he made, and so on. I fully expected to have to go through it line-by-line and figure out what he had done for myself. And yet, that’s what’s happening to climate scientists, nowadays. They get all these crazy requests for extensive annotations, private e-mails, all drafts of a paper, work that they hadn’t finished, yet, etc., etc. We can condemn the East Anglia guys for trying to duck the FOI requests, but personally, I would have been strongly tempted to tell the people making the silly request to take a flying leap, too.
4. In their peer-reviewed publications, the “Hockey Team” was always clear about what they were doing by appending the instrumental temperature and leaving out the tree-ring data at the end. What they did was completely legitimate. The only time I know of that this wasn’t clear was when Phil Jones did a version of the graph for the cover of a glossy pamphlet for the WMO. So what? He had already published the details.
5. As quite a bit of subsequent work has confirmed, the “Hockey Stick” is essentially right (within the error bars).
So yeah, I’d say their MO was quite a bit better than Spencer’s. Much of his work is demonstrably wrong, and instead of subjecting it to peer review he uses his credentials to impress the general public with sheer nonsense. He sometimes doesn’t respond to information requests that would take him less than a minute to respond to. And, well, he does plenty of chest-beating, just like Phil Jones did. He does it in public, rather than just private e-mails, however.
By: Barry Bickmore on June 4, 2011
at 8:22 am
Breathtaking rationalization, absolving your side of chicanery you would never forgive in your opponents.
By: Bart on June 4, 2011
at 11:50 am
Well said Barry. That’s one of the best descriptions of ‘Climategate’ I’ve seen. The denialist obsession with the stolen emails is really, really annoying.
By: Dana on June 4, 2011
at 1:59 pm
“As all the “Climategate” review panels have noted…”
There is a lack of introspection on both sides of the global warming argument. In my opinion, this introspection, evidenced by the whitewashes you call “review panels” and the reverence with which proponents of CAGW view the Hockey Stick, is nearly non-existent on your side of the debate. The fact that your side is indoctrinating and scaring the hell out of children with this unproven hypothesis is despicable at best and reeking of desperation.
By: Daniel on June 5, 2011
at 8:11 pm
You make accusations of indoctrinating children and take offense at the term “denier”? Really?
By: Dana on June 5, 2011
at 9:20 pm
Can you give a specific example of something the review panels “whitewashed”?
As for my “reverence” for the Hockey Stick, I actually think it is overused. It makes a dramatic picture, but the fact is that until the last 50 years or so, nobody thinks the warming was dominated by human causes, so it can give a wrong impression.
Regardless of how some people hype it, however, the scientists involved have been careful to only make statistically valid claims about what the Hockey Stick means. And these claims have been borne out by quite a bit of further research (which, by the way, used different temperature proxies and different statistical techniques.)
What blows me away is how the contrarian crowd gets so fixated on things like McKittrick and McIntyre’s charges about the original statistical technique, or “Mike’s Nature Trick”. If the results have been borne out by further research, any mistakes were probably quite minor. And like I said, “Mike’s Nature Trick” was perfectly legitimate.
By: Barry Bickmore on June 6, 2011
at 8:55 am
“You make accusations of indoctrinating children and take offense at the term “denier”? Really?”
Al Gore’s flawed documentary has been included in science curricula in schools around the world and presented as unassailable proof of CAGW. All meant to scare and brainwash children.
PBS for kids has been infiltrated by environmental loons to an almost comic level. Tune in a time or two to the “Wild Kratts”. In every episode an evil, rich businessperson is intent on destroying the last enclave of one endangered species or another. So far the heroic Kratt brothers have stymied the deviousness of the wealthy evil doers.
Assorted propaganda videos – some you’ve seen on TV some paid for by government:
http://www.abovetopsecret.com/forum/thread615885/pg1
Make you proud?
By: Daniel on June 8, 2011
at 7:26 pm
“Can you give a specific example of something the review panels “whitewashed”?
As for my “reverence” for the Hockey Stick…”
From the selection of the panelists themselves to the glossing over of significant wrongdoing by the people involved – there was never a serious attempt to look at the Hockey Team’s abuse of power given their positions at the hub of climate science. Panel members like Boulton, Russel and Oxburgh had previously expressed support for the CRU before they were chosen. Oxburgh is the director of two renewable energy companies. Phil Jones openly admitted to deleting “loads of emails” while under pressure from FOI requests. The work these guys were doing was at the very least, heavily subsidized by the government (tax money). He should have been sacked for his lead role in the activity (I believe he expected it), but was given less than a wrist slap.
I asked you a year or so ago to rate the Hockey Stick as a significant achievement of climate science. You gave it an 8 on a scale of 1 to 10, ten being super science. What is the most important scientific achievement of climate scientists to date?
By: Daniel on June 8, 2011
at 7:44 pm
Ah yes, the old “teaching kids science I don’t like is brainwashing” routine.
By: Dana on June 8, 2011
at 10:29 pm
Hi Daniel,
As I said before, ditching FOI requests was the only thing I thought the CRU guys really did wrong. However, I thought their reaction was understandable, given the circumstances.
In any case, I don’t see that you have brought up any other issues, and this particular one doesn’t really have anything to do with the science in question. As I said, the Hockey Stick has been essentially reproduced over and over, with different proxy data and statistical techniques. So the whole thing boils down to Phil Jones getting a bit annoyed and vindictive about some people sending frivolous FOI requests to distract his team. Oh, I’m just super indignant about that. Heads should roll! Give me a break.
You also asked what I think the most significant achievement of climate scientists is to date. I would say it is constraining climate sensitivity from a number of different lines of evidence, including data that spans timescales ranging from decades to hundreds of millions of years. If you keep getting roughly the same answer over such different timescales, it is likely that you’ve captured the 800-lb gorillas.
By: Barry Bickmore on June 9, 2011
at 7:58 am
“and this particular one doesn’t really have anything to do with the science in question.”
FYI none of the inquiries really looked at the science. As for the CRU scientists being inundated with FOI requests – I’d like to think that a body as influential as they were/are would be organized and staffed enough to hand the FOI request to a grad student and tell them to comply.
You seem to ignore or trivialize Jones’ deleting “loads of” emails that must have been damaging to their process or findings. Do you think that scientists, working on the government dime, have an obligation to preserve the documentation used in their jobs?
By: Daniel on June 9, 2011
at 7:22 pm
Hi Daniel,
Why should the review panels have done some in-depth review of the science? That had already been done by the NRC in 2006, and they had some minor statistical quibbles, but that was it. As I said, the Hockey Stick has been essentially reproduced by a number of subsequent studies.
And no, I don’t think scientists have some obligation to save all their e-mails for every nosy jerk who wants to take their off-the-cuff statements out of context. Here’s what I think they have an obligation to do:
1. Archive their data and make sure any that isn’t proprietary is publicly available in some form.
2. Clearly explain their methods and results in peer-reviewed publications.
If they do that, then competent people should be able to reproduce what they did, and judge it on its merits.
By: Barry Bickmore on June 9, 2011
at 10:39 pm
Uh, Bart…
Since I pointed out that you were wrong to accuse me of saying the deep ocean isn’t heating significantly (i.e., you didn’t read my posts carefully), I don’t know what the problem is.
Also…
1. You still haven’t produced a single paper on the subject of statistics. (Hey, since you’re anonymous, maybe you could just find one by anyone named “Bart”. I probably wouldn’t check.)
2. You still haven’t shown how kdkd’s arguments have anything to do with mine.
Who’s blustering?
By: Barry Bickmore on June 4, 2011
at 7:57 am
I wasn’t wrong. I was needling you.
I take it then that your claim is that the heat is in the deep oceans?
One word: Epicycles. The AGW crowd is just piling it higher and deeper.
Face it. The heat is gone. And, with it, the cause for panic. Get your parachute ready. Time to bail.
By: Bart on June 4, 2011
at 11:46 am
Yea, well Eli’s paper trail is longer than yours and he is only a Bunny.
By: Eli Rabett on June 4, 2011
at 1:05 pm
The heat is gone? That’s quite the magic trick! Next can we make Bart disappear?
By: Dana on June 4, 2011
at 2:00 pm
“I wasn’t wrong. I was needling you.”
Blustering.
By: Barry Bickmore on June 6, 2011
at 8:57 am
Barry said, “the “Hockey Stick” is essentially right (within the error bars)”.
Say what? When the error bars exceed the amplitude of the actual tempurature findings, and that’s OK, I have to say “huh?” Oh, that’s part of that statistics thing that Barry’s an expert at and that he raked “Bart” over the coals with. In a strange way, it’s kind of like supporting the notion that “97% of practicing published climate scientists” state that man is causing global warming, except that there are no confidence intervals (error bars, if you will). When I asked Peter Doran why he didn’t include this his basic response was “huh?”
Yes, Barry is an expert at spotting the statistical significance of the hockey stick as well as brilliantly broadcasting the “97%” figures that are strangely also heralded by skeptical science and real climate. I have a question for Barry, maybe he should take Doran and Zimmerman’s study to Gallup or Zogby and ask if it’s ok to extrapolate that 97% of climate scientists the world over agree based on the way the study was handled statistically.
When this thing is all over, (and hopefully soon) all I can say is “Nuremburg trials, anyone?”
No further comment.
By: Scott on June 4, 2011
at 5:25 pm
It amazes me that anyone can still deny the scientific consensus. Doran was just one study among many. I think even more important than Doran was the Oreskes study finding virtually no peer-reviewed scientific papers rejecting the consensus, which was subsequently confirmed by Peiser, even though he was trying really hard to refute it.
It’s bad enough to believe the conspiracy theory that the consensus is due to climate scientists being on the “AGW gravy train”, but to deny the consensus exists? That’s on par with denying the planet is warming.
By: Dana on June 4, 2011
at 6:22 pm
“It amazes me that anyone can still deny the scientific consensus.”
What amazes me, given the media’s unchallenging fidelity, is that there isn’t a poll every month with 10s of thousands of scientists proclaiming their allegiance to the climate change orthodoxy.
A simple poll I would like to see, presented with a guarantee of total anonymity to scientists across the world:
How close does this statement represent your views on the human contribution to climate change.
“I believe and would stake my scientific reputation, that the continued human production of CO2 and other GHGs will cause climate change resulting in catastrophic impact to the human race and the planet in general in the next 100 years.” Choose the answer that best fits your belief.
__ Agree
__ Disagree
__ Don’t know
By: Daniel on June 5, 2011
at 8:38 pm
Daniel,
Your survey isn’t as clear-cut as you think. I have never heard that “catastrophic” is the only possible, or even the most probable, outcome scientists are projecting.
By: Barry Bickmore on June 6, 2011
at 8:59 am
OK Dr. Bickmore let’s add your qualifier from anther thread: “I believe and would stake my scientific reputation, that the continued human production of CO2 and other GHGs will cause climate change resulting in really bad or catastrophic impact to the human race and the planet in general in the next 100 years.”
By: Daniel on June 8, 2011
at 7:50 pm
Here’s the statement I would sign.
“I believe and would stake my scientific reputation, that continued human production of CO2 and other GHGs at present rates or greater will end up costing far more than it would have to cut emissions.”
By: Barry Bickmore on June 9, 2011
at 8:01 am
Hi Scott,
I’m not sure what your point is. Recent temperatures do exceed the error bars for the 1-2 thousand years before that… which, to my knowledge, was the only conclusion Mike Mann, etc., tried to draw from the “Hockey Stick”. If that’s all they drew out of it, what’s the problem?
Now, Scott, when did I ever claim to be an expert at statistical anything? All I said was that Bart doesn’t seem to know much about it if he thinks that a trend over 8 years of REALLY noisy data is very meaningful. Whatever else I don’t know, I at least know how to make MATLAB calculate confidence intervals for a trend. I pointed this out because I’ve actually done these calculations for the global temperature data, and such short trends aren’t meaningful. The heat content data looks about the same or even noisier to me, so I question Bart’s confident assertions.
So there you have it… a clear reason why I question Bart’s assertion. (And by the way, the only reason I questioned whether he had studied statistics is that in his first post he questioned whether Arthur or I had studied differential equations. At least I gave a reason why I thought he didn’t know much about statistics.) What is your reason for questioning Doran’s results? I’m fine with the idea that they should have calculated some error bars, but how big do you think those error bars would be?
I’ve seen plenty of political polls that had much smaller samples as a proportion of the total voter population (a few hundred representing millions), and their margins were only +/- a few percent. Anderegg got essentially the same result when looking at the top 200 publishing climate scientists (no error bars there, because they sampled the entire population.) As Dana mentioned, Naomi Oreskes got similar results when looking at numbers of publications. So whether I think they should have calculated some error bars, or not, I can’t see any reason to think the “consensus” percentage isn’t in the high 90’s, somewhere.
So do you have some reason to question these results?
Do you have some reason to believe that the trend Bart cites is statistically significant?
If so, let’s hear it!
By: Barry Bickmore on June 5, 2011
at 7:59 am
And by the way, I don’t think you have to worry about anything like the Nuremburg trials after this is all settled. People will just make fun of you for glomming onto weird conspiracy theories to give yourself an excuse for rejecting some pretty clear scientific conclusions. Oh, and they’ll make fun of you for being so sure that your medical degree gives you the tools to find all kinds of obvious flaws in what well over 90% of the real experts are saying.
I’m sure you can handle it, though. “If you can’t stand the heat, get out of the kitchen,” I say!
By: Barry Bickmore on June 5, 2011
at 8:37 am
By: Dana on June 4, 2011
at 2:00 pm
“The heat is gone? That’s quite the magic trick!”
It’s not difficult to make something disappear which isn’t there, i.e., which never accumulated, in the first place. Do you make it a habit to toss out random jibes without knowing what the discussion is about?
By: Bart on June 5, 2011
at 2:55 am
Bart,
I will draw your attention to the quotation I provided from the IPCC Report above. It said that there could be a problem with the models, or with the deep ocean data, because there isn’t very much of it. I note that they point out all the possibilities, whereas you are absolutely sure about the source of the error. I note that they point out the model predictions and the data have overlapping error bars, so they could just sweep the POSSIBLE discrepancy under the rug, but they don’t. You, however, never seem to mention the error bars, because you KNOW there is a discrepancy.
By: Barry Bickmore on June 5, 2011
at 8:22 am
I’m quite aware of the ‘missing heat’ issue, thanks. In fact Trenberth has a draft paper out in which he infers that the heat is indeed in the deep oceans. To suggest the heat was never there is simply wrong. The reason the heat is ‘missing’ is because we know it’s got to be somewhere, because of the global energy imbalance. The radiative forcing from the GHG increase has to go somewhere.
Perhaps I should apologize for the sarcasm. I no longer have the patience for arguing with global warming deniers that Barry has. When you say silly things, rather than point out how silly they are, I’ll often just go straight to the sarcasm, because frankly I’ve become rather saturated with ridiculous denier arguments over the past 5 years. And yes, to suggest that the energy imbalance has either magically disappeared or never existed to begin with is incredibly silly.
By: Dana on June 5, 2011
at 11:16 am
“And yes, to suggest that the energy imbalance has either magically disappeared or never existed to begin with is incredibly silly.”
Because your measurements are perfect, your knowledge of the past is irrefutable, and there is no uncertainty anywhere in the chain of kevlar links which leads you to your conclusions.
“…global warming deniers…”
I know you use such terminology to get under the skin of your interlocutors. It definitely works. Why you think that advances your cause, I have no idea. But, I do know that it is utterly contemptible to trivialize the worst genocide ever perpetrated by labeling opponents in a comparably minor debate as though they were bloodstained, eliminationist monsters. The only ones I see trending that way are… you guys, e.g.,
“Next can we make Bart disappear?”
Which is precisely why I choose to post anonymously and refuse to divulge details of my curriculum vitae. Your crowd is vindictive, and I do have people who depend on me to provide for them.
By: Bart on June 5, 2011
at 2:47 pm
I must repeat this: Bart “…global warming deniers…”
“I know you use such terminology to get under the skin of your interlocutors. It definitely works. Why you think that advances your cause, I have no idea. But, I do know that it is utterly contemptible to trivialize the worst genocide ever perpetrated by labeling opponents in a comparably minor debate as though they were bloodstained, eliminationist monsters. The only ones I see trending that way are… you guys, e.g.,”
This observation is spot on. It’s difficult to get past the sense that you are dealing with puerile, unconfident canon whenever you see the term “denier or denialist”. It’s rife on Dana’s website. “Skeptical Science”, an internet con job to try to hide that they are basically a professional functionary for the globalchange.gov line on climate change.
By: Daniel on June 5, 2011
at 8:44 pm
Geez sorry ladies, I didn’t realize labeling somebody who denies facts a “denier” would offend your delicate sensibilities. See, there’s that sarcasm again. No question it’s deserved this time though. Daniel – thanks for the laugh!
By: Dana on June 5, 2011
at 9:01 pm
I tend to avoid the term, just because it offends some people. However, the term “in denial” (and other variants) is incredibly common, nowadays. I don’t understand why you would think that anyone who says that is equating you with Nazis. To me it just seems like an excuse to start whining about how mean the “other side” is.
By: Barry Bickmore on June 5, 2011
at 10:23 pm
Oh, and Daniel, weren’t you the one who was throwing out the Nuremburg trials? Clearly, you were equating “the other side” with Nazis, whereas Dana very well may have meant no such thing. Buck up.
By: Barry Bickmore on June 5, 2011
at 10:25 pm
“Daniel – thanks for the laugh!”
Seriously Dana, you ought to consider going full-phony with “Skeptical Science”. How about “What’s up With Hats” or “Climate Plaudit”?
By: Daniel on June 8, 2011
at 8:16 pm
BTW, Bart and Scott,
I just did the calculation, and recent 8-year slopes in the OHC data have all been positive, but not always statistically significant. The data for the last 7 years I got from Roy Spencer’s plot, however, so I won’t swear to it. Do you know where to get updated OHC data, Bart?
By: Barry Bickmore on June 5, 2011
at 8:54 am
“And by the way, the only reason I questioned whether he had studied statistics is that in his first post he questioned whether Arthur or I had studied differential equations.”
It was a touch of snark because I do not really want to teach an entire course on linearization of differential equations, tangent spaces and differential flows, etc…, in a blog post These models are far more malleable than you guys seem to understand. You treat them as though they were global solutions, extrapolate them beyond local bounds, and then proclaim them wanting on the basis of reductio ad absurdum. That simply is not a valid method of refutation.
“You, however, never seem to mention the error bars, because you KNOW there is a discrepancy.”
I know that there has been a dramatic change in the last decade. Any test of statistical significance you care to make is founded upon certain assumptions of the underlying model, and I have seen far too many people in this field making unwarranted conclusions based on data which have not been demonstrated to satisfy those assumptions. As a general rule of thumb, though, if you can see it with cursory inspection via the naked eye, it is significant.
You are at the edge of the precipice. In the next few years, if OHC and global temperatures resume their upward march, you can shrug off the hitch in the data as an anomaly and a moot question, and continue business as usual. However if, as appears likely, these indices plunge, the AGW crowd is going the way of the dodo. I have placed my bets, and presumably you, yours. We will have to wait and see what happens.
However… the thing that really rankles me about the whole contretemps is this: if we are capable of reasonably betting on this one way or the other, then the subject is not nearly (or, at all, if you prefer, and I do) so cut and dried that major policies which affect the well-being of every person on the globe should have been advanced on the basis of what amounts to pure speculation. The AGW crowd has bet the ranch, staking the reputation of Science across the board. If AGW turns out to have been just the latest Chicken Little alarum, every branch and every gradation of Science is going to bear the consequences of a jaded public which must be begged, wheedled, and cajoled for every scrap of funding. It was a hell of a wager to make, and it was done without soliciting the buy-in of all those who stand to lose big-time when it comes a cropper.
By: Bart on June 5, 2011
at 2:31 pm
Hi Bart,
I don’t think you have captured the points Arthur and I were making. Do you disagree that the parameters in Roy’s model are supposed to have physical meaning, and that they ought to be constrained within physically reasonable bounds? Do you dispute that the model has an exponential decay function built in, so that by manipulating the starting temperature anomaly and equilibrium temperature, Roy could fit the entire first half of the data without much effect from the PDO driving function? Do you dispute that the alpha, beta, and mixed layer depth parameters were perfectly covariant for best-fit solutions, so there were an infinite number of best-fit solutions?
If you do disagree about those points, I don’t have anything to say to you. If you don’t disagree about those points, I can’t understand why you would defend Roy’s model. If your only point is that he still fit the data pretty well, no matter what the criticisms of the model, all I can say is that you clearly don’t have a good grasp of how modeling is done in the Earth Sciences. Maybe you’re an engineer–they tend not to care whether the parameters are realistic if they can make the model work within certain bounds.
Also, eyeballing the data is fine, as long as it is followed by actual calculations to back up your impressions. I did that earlier today, and it turns out that there have been just as dramatic changes in the 8-yr slope over the course of the record. What’s more, the 8-yr trend has even sometimes been negative, which it is not, at this point.
By: Barry Bickmore on June 5, 2011
at 5:52 pm
“Do you disagree that the parameters in Roy’s model are supposed to have physical meaning, and that they ought to be constrained within physically reasonable bounds?”
I disagree that they must have your particular meanings. They are sensitivities. Partial derivatives. They need not correspond to your blinkered vision of what they must be. They may be merely “effective” parameters for the implicit linearization of the underlying nonlinear equations.
For example, when astronomers use the method of variation of parameters to propagate an orbit under the influence of Earth’s oblateness, they use a value of the mean motion which is modified by J2. It is no longer the same value as it would be in classical orbit analysis. It is not, by definition, the mean motion anymore. But, it is the mean motion’s stunt double for the task, and it works. It is the “effective” mean motion under the operating condition of low Earth orbit.
“Do you dispute that the model has an exponential decay function built in, so that by manipulating the starting temperature anomaly and equilibrium temperature, Roy could fit the entire first half of the data without much effect from the PDO driving function?”
It is immaterial. Do you claim that the PDO and the temperature record are wholly uncorrelated? Do you think that the common cyclical behavior of the two is mere coincidence?
“Do you dispute that the alpha, beta, and mixed layer depth parameters were perfectly covariant for best-fit solutions, so there were an infinite number of best-fit solutions?”
Do you dispute that the IPCC models can produce the same general output with a wide range of covarying forcing and feedback combinations?
By: Bart on June 5, 2011
at 11:48 pm
Hi Bart,
You say you disagree with the particular physical meanings **I** gave to the parameters in Spencer’s model, but Roy is the one who gave them, not me. And he spent a few pages discussing why he thought they were physically reasonable. So if your point is that we shouldn’t take Spencer’s fitted parameters (e.g., his feedback factor) very seriously, then I wholeheartedly agree. (BTW, I’m perfectly aware of “effective” parameter values. In fact, I discussed how others have shown that while the mixed layer depth is 50-100 m, you have to jack it up a little over 100 m to compensate for the fact that a 1-box model doesn’t have any heat transport into the deep ocean. 700 m is a bit over the top, don’t you think? “Effective” parameters incorporate adjustments like these, but they typically aren’t totally unrecognizable next to their “real” counterparts.)
Furthermore, how could the PDO and the temperature record possibly be “wholly uncorrelated,” when the PDO is partially derived from the temperature record for a large region of the globe? Spencer’s claim was that if we assume the PDO is driving the global climate, it can explain MOST of the temperature variation over the past century. This is flatly untrue. He got his model to fit the data for the first half of the century, but not so much the last half. However, he was only able to fit the first half by jacking up the exponential decay, which has nothing to do with the PDO.
I see also that you dodged the question of whether Spencer could have picked from an infinite number of equivalent best-fit solutions. Instead, you try to imply that the IPCC models are just as bad. But you’ve missed the point once again. Models like those the IPCC uses are more complicated than a 1-box model, so OF COURSE there are lots of possible parameter combinations that could fit the data equally well. So what do the modelers do? They constrain their parameters to a certain range of values that are PHYSICALLY REASONABLE. Some of these aren’t constrained very tightly, so you still get a range of solutions in the IPCC report, but it is a range of PHYSICALLY REASONABLE solutions.
By: Barry Bickmore on June 6, 2011
at 7:51 am
I can’t explain it, but I can’t understand it for you. You’re on your own, Barry. One day, you will wish you had listened.
By: Bart on June 6, 2011
at 8:03 pm
Well, if you can’t explain it, what good would it have done to have listened?
By: Barry Bickmore on June 6, 2011
at 8:12 pm
can (and did) explain it I mean, of course.
By: Bart on June 6, 2011
at 8:12 pm
Sure you explained it, Bart. You said it’s unfair to insist that Spencer’s model parameters be held to physically reasonable values. But you didn’t really explain why anybody should take Spencer’s fitted feedback factor seriously when none of the other parameters are physically reasonable. You also didn’t explain why we should believe Spencer that the PDO is the major climate driver, when the first half of his model production was controlled by the built-in exponential decay (NOT the PDO), and the second half didn’t fit the data well at all. And you didn’t explain why it was ok for Spencer to choose best-fit parameter combinations he liked, when there were an infinite number of combinations that would have produced the exact same curve–and some of those combinations were physically reasonable.
It seems to me that your point of view is that Spencer showed that the PDO COULD be the major climate driver. But he did no such thing. All he showed was that you could fit a curve (sort of) with 5 adjustable parameters without any reference to physical reality.
By: Barry Bickmore on June 6, 2011
at 8:35 pm
“What’s more, the 8-yr trend has even sometimes been negative, which it is not, at this point.”
It is qualitatively different by abruptness and duration. Moreover, you are comparing apples to oranges. The measurements which show the current stagnation are orders of magnitude more precise than what came before. You are rationalizing.
By: Bart on June 5, 2011
at 11:52 pm
Wait… the data is what it is, and it’s all we have. I did the statistics on the only data we have, and based on that I say that the last decade hasn’t been dramatically different than other episodes in the 55-year record. And then you come back and say that the most recent data is so much better than the older stuff that my statistical calculations don’t mean much. But if so, how do you know the last decade is so dramatically different?
By: Barry Bickmore on June 6, 2011
at 9:10 am
Doesn’t matter. If measurements of the earlier periods were the same, you’d have nothing to hang your hat on at all.
Is that just too obvious to have noticed?
By: Bart on June 6, 2011
at 8:08 pm
Honestly, Bart, I have no idea what you are talking about.
By: Barry Bickmore on June 6, 2011
at 8:15 pm
By: Dana on June 5, 2011 at 9:01 pm
“Geez sorry ladies…”
And, a hearty **** you, too, right back atcha’. Creep.
[BRB: Bart, don’t post profanity on my blog.]
By: Bart on June 5, 2011
at 11:53 pm
Sorry, Barry, if that offends. But, the Holocaust is no joking matter, and dimwits like Dana (calling other men “ladies” is probably compensating for having a girl’s name, among other deficiencies) who joke about it should be shunned by any decent person.
“…whereas Dana very well may have meant no such thing/”
In a pig’s eye, and you know it perfectly well. Don’t piss on my boots and tell me it’s rain.
By: Bart on June 6, 2011
at 12:01 am
Bart,
You forget that I hang around with lots of people who believe humans are causing significant climate change. I can assure you that the vast majority of them (aside from a few extremist weirdos) simply use the words “denial” and “denier” to denote pig-headed refusal to face facts. No, it’s not complimentary, but it is a generic term that is not necessarily linked to any one subject. That’s why climate deniers are called “climate deniers” and Holocaust deniers are called “Holocaust deniers”. If you care to look at the Wikipedia article on “Denialism,” you will see that people who deny the HIV-AIDS connection have been called “AIDS denialists”.
http://en.wikipedia.org/wiki/Denialism
I found this paragraph particularly enlightening:
“The broad use of the word denialism is controversial, as it has been criticized as a polemical method of suppressing non-mainstream views.[17] Similarly, in an essay discussing the general importance of skepticism, Clive James objected to the use of the word denialist to describe climate change skeptics, stating that it “calls up the spectacle of a fanatic denying the Holocaust”.[18] Celia Farber has objected to the term AIDS denialists arguing that it is unjustifiable to place this belief on the same moral level with the Nazi crimes against humanity.[19] However, Robert Gallo et al. defended this comparison, stating that AIDS denialism is similar to Holocaust denial as it is a form of pseudoscience that “contradicts an immense body of research”.[20]”
Did you get that? “Denial” is used to denote “a form of pseudoscience that contradicts an immense body of research.” If climate contrarians and AIDS contrarians do that, then they are “similar to” Holocaust deniers IN THAT they use the same types of mental gymnastics.
So in other words, Dana was merely pissing in your boots. He didn’t pretend it was a compliment–he just objected when you put words in his mouth.
By: Barry Bickmore on June 6, 2011
at 9:35 am
Well said again, Barry. I have a hard time figuring out whether deniers really honestly think we’re invoking the Holocaust, or if they just bring it up as a distractionary tactic (I strongly suspect the latter). When you deny facts, what do you expect to be called?
And to suggest I’m joking about the Holocaust by calling somebody a denier is just plain dumb.
By: Dana on June 6, 2011
at 9:47 am
If it weren’t a completely hamfisted reference to looney holocaust deniers, it would have no sting. You know it. I know it. So, let’s dispense with the charade, shall we?
By: Bart on June 6, 2011
at 8:06 pm
Did you ever consider the possibility that it’s not intended to “have sting”? I don’t call a spade a spade to “sting” the spade.
By: Dana on June 6, 2011
at 9:53 pm
“…you were equating “the other side” with Nazis…”
And, just one more thing on this. It wasn’t Daniel, it was Scott. Regardless, it’s not the sort of thing you say if you want to engage serious dialogue.
But, that said, it is far less egregious than what “Dana” is doing. You can call me anything you like – I consider the source when deciding to be personally offended. But, when you trivialize the suffering of a vast sea of humanity for your own mean-spirited jollies, you have jumped the rails. Too bad Dana’s grandparents weren’t there to see the reality of it firsthand.
By: Bart on June 6, 2011
at 1:05 am
Sorry to Daniel, then.
By: Barry Bickmore on June 6, 2011
at 7:21 am
Show me one place where I said anything about the Holocaust, Bart. Geez dude, grow the hell up.
By: Dana on June 6, 2011
at 9:48 am
Cram it.
By: Bart on June 6, 2011
at 8:06 pm
“Surely it’s time for climate-change deniers to have their opinions forcibly tattooed on their bodies.
Not necessarily on the forehead; I’m a reasonable man. Just something along their arm or across their chest so their grandchildren could say, ”Really? You were one of the ones who tried to stop the world doing something? And why exactly was that, granddad?”
On second thoughts, maybe the tattooing along the arm is a bit Nazi-creepy. So how about they are forced to buy property on low-lying islands, the sort of property that will become worthless with a few more centimetres of ocean rise, so they are bankrupted by their own bloody-mindedness? Or what about their signed agreement to stand, in the year 2040, lashed to a pole at a certain point in the shallows off Manly? If they are right and the world is cooling – ”climate change stopped in the year 1998” is one of their more boneheaded beliefs – their mouths will be above water. If not …
OK, maybe the desire to see the painful, thrashing death of one’s opponents is not ideal. But, my God, these people are frustrating. You just know that in 20 years’ time, when the costs of our inaction are clear, the climate deniers will become climate-denial-deniers. ”Who me? Oh, no, I always believed in it. Yes, it’s hard to understand why people back then were so daft. It’s so much more costly to stop it now.”
http://scienceblogs.com/casaubonsbook/2011/06/climate_change_denialist_tatto.php?utm_source=networkbanner&utm_medium=link
Sign me up for the “forced (purchase of) property on low-lying islands” punishment.
By: Daniel on June 8, 2011
at 8:06 pm
Hi Daniel,
Why are you posting what some random blogger said? Are you saying that someone posting here shares that viewpoint?
By: Barry Bickmore on June 9, 2011
at 8:19 am
Dr. B,
I apologize if that post was off-topic. Delete it if you want to. I thought it relevant to the discussion of the term “denier” and the propensity of one side or the other of a political debate to track toward threats of physical retribution and killing. It starts when we denigrate our opponents, tag them “deniers”, “zealots”, “anti-science”, “anti-education” etc. We start the dehumanization process and… well you know what can happen next. And no, I don’t think anyone in our discussion here agrees with the author of that article…except maybe Dana. I kid, I kid :>)
Dan
By: Daniel on June 9, 2011
at 8:13 pm
Ok. The blog post you quoted was specifically labeled as a joke, however.
Do you have any examples of “deniers” being the target of death threats? The only one I ever heard of looked like an obvious hoax.
By: Barry Bickmore on June 9, 2011
at 10:28 pm
[…] with GISS forcing estimates and fit it to ocean heat content (OHC) data since 1955. Once again, I reviewed his methods and found he had made several elementary mistakes, ALL of which drove his model climate sensitivity […]
By: Just Put the Model Down, Roy « Anti-Climate Change Extremism in Utah on July 26, 2011
at 11:18 am
[…] GISS forcing estimates and fit it to ocean heat content (OHC) data since 1955. Once again, I reviewed his methods and found he had made several elementary mistakes, ALL of which drove his model climate sensitivity […]
By: Just Put the Model Down, Roy on August 2, 2011
at 7:19 am
[…] […]
By: Say It Ain't So: CFCs, Not CO2 May Be to Blame for Global Warming Patterns - Page 3 on June 11, 2013
at 2:02 pm
[…] […]
By: Say It Ain't So: CFCs, Not CO2 May Be to Blame for Global Warming Patterns - Page 5 on June 12, 2013
at 7:37 am